Over the past few years, data has become a very crucial part of our daily lives. Every new product, from prescription drugs to Netflix movies recommended to you, and nowadays, candidates running for office, will have gone through rigorous statistical analysis before being presented to consumers or voters.
However, Tuesday night’s election results have left many believing that the entire polling system was designed to give us false hopes of a Clinton victory. How could the pollsters be so wrong? Most websites, including the New York Times, Huffington Post, and pundits, all assured us that Clinton was going to hold her lead in most of the swing states and become the next president of the US. Even Nate Silver, who is revered for his accuracy, had predicted a 71.6% chance of Clinton winning. How is it that all these pollsters and pundits were blind-sighted sobadly?
For McGill students failing to see the importance of POLI 311 and antagonized by statistics, Tuesday’s results seem to reinforce the idea that stats are overcomplicated, useless, ineffective at providing serious predictions, and that we should do away with them. In reality, however, statistics are important, now more than ever, to analyze exactly why Clinton lost.
The Clinton campaign was criticised for being over-reliant on data comparing to the more ‘organic’ Trump campaign. However, it seems as the problem was in the quality of Clinton’s data, rather than in the use of it.
The past few decades have seen remarkable improvements in polling and prediction. Faster computers, more data and better models brought predictions to higher levels of statistical accuracy. However, to understand the failures of Tuesday’s polling results before blaming polling companies of a lie, we have to understand the essence of statistics better.
An important term used in polling and other statistical analysis is the concept of randomization. This a crucial concept in achieving unbiased statistical results. Let’s take an example in which one tries to find out the statistical distribution of students among McGill faculties. Suppose that a statistician walks into an economics class, and asks 100 students which faculty they are in. Chances are that most will be in Arts or Management. Does that mean most of McGill students are in only 2 faculties? Probably not. On the other hand, if he instead stands at the Y-intersection and poll 100 ‘random’ people about which faculty they are in, he gets a more accurate picture of the distribution.
Let’s take an example from the recent election. Now, even in the era of cell-phones and caller ID, polling is still mostly done over phones. Back in the day, when people used landlines and did not have caller ID, it was easier to randomize polling data collection because people would just pick up the phone and get stuck answering the various questions that pollsters ask. Nowadays, if we get calls from an unrecognized number, it is very likely that we will reject the call. Thus, the polling data is left systematically biased, in favour of people who would pick up. Imagine that Donald Trump repeatedly tell his voters that the polls are rigged, and his voters are dissuaded from participating in the polls. This biases the polling data in favour of Hillary Clinton and results in a phenomenon where Trump voters are undersampled.
Traditionally, statisticians are very good at dealing with certain types of undersampled data. For example, if statisticians realise that very few of the people picking up the phones are black, they will pull up data from the Census Bureau see what percentage of the population is black. Then they will use ‘historic averages’ to predict how black voters usually vote in elections. These two measures will allow statisticians to calculate the weight for black voters and will give a fairly accurate representation on average of how black voters will behave.
Using the same techniques, statisticians can also come up with a fairly accurate prediction of how college-uneducated white male voters will behave. But the key word is, again, ‘historic average’. The assumption that the voting climate will stay similar to the ‘historic average’ is a very tall assumption, one that likely led to the failure of most polling this year. as the Harvard Business Review put it: “as long as voter behaviour stays stable, these models should work.”
The Trump campaign’s ability to mobilize their voters in higher numbers than their historic average, results in a prediction failure. Many of Trump voters were undersampled or exceeded their participation expectations, and traditional polling techniques had failed to follow that.
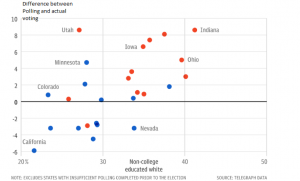
(Image courtesy of: The Telegraph)
A positive gap means that actual results were better for Trump. So, we can see that the states where the proportion of uneducated white voters is high, are the states where polls had a wider margin of error, meaning these voters may have been undersampled and they participated at a higher rate than historic average. In Utah and Indiana, the polls were wrong by as much as 8.6%. In California as well, the polling was significantly off from actual voting, however the results favored Clinton. An interesting parallel with 2008, when black voters broke historic records, coming out in droves to vote for Barack Obama.
Also, an important point to mention is that Clinton lost Florida, Michigan and Pennsylvania by less than 2%, which is well within the margin of error for most of the polls conducted. (see Real Clear Politics for further research.)
One thing that still holds true, even if by the tightest margin, is that Hillary is currently leading in the popular vote, by a margin of only 0.2% (although the Real Clear Politics average had suggested a lead of nearly 2%).
A final point worth noting is this phenomenon of so-called ‘hidden’ voters. These are essentially people whose voting patterns are not captured by polls. This ties in with the inability of polling agencies to deal with situations that diverge from historic averages, and undersampled data. By many accounts, there seems to have been a surge this year in voters who voted for Trump but were completely missed by polls– either because they misled pollsters, or because they did not respond to polling agencies.
This article is not a justification of the polling error we witnessed Tuesday night, but rather an investigation as to what may have happened. It is also a suggestion for a direction moving forward from here in terms of polling. For now, most pollsters will hang their heads low while nursing their bruised reputation. Gathering better information and data is vital for successful polling. There is no consolation at the end of this bitter and divisive American experiment. We will just have to wait for the next round of senate races to see if pollsters have learned anything from this year’s election.
For Further Reading:
http://www.cnn.com/2016/11/09/politics/donald-trump-hillary-clinton-popular-vote/https://www.theguardian.com/commentisfree/2016/nov/09/polls-wrong-donald-trump-electionhttp://www.newstatesman.com/world/north-america/2016/11/why-were-us-polls-wronghttps://hbr.org/2016/11/why-pollsters-were-completely-and-utterly-wronghttp://www.telegraph.co.uk/news/2016/11/09/how-wrong-were-the-polls-in-predicting-the-us-election/


